Strait of Hormuz:
Map, Status, Oil Impact & 2026 Crisis
Everything you need to know about the world’s most critical oil chokepoint — location, live status, blockade news, oil impact, pronunciation, and more.
📋 Contents — Jump to Any Section
Strait of Hormuz Map & Location
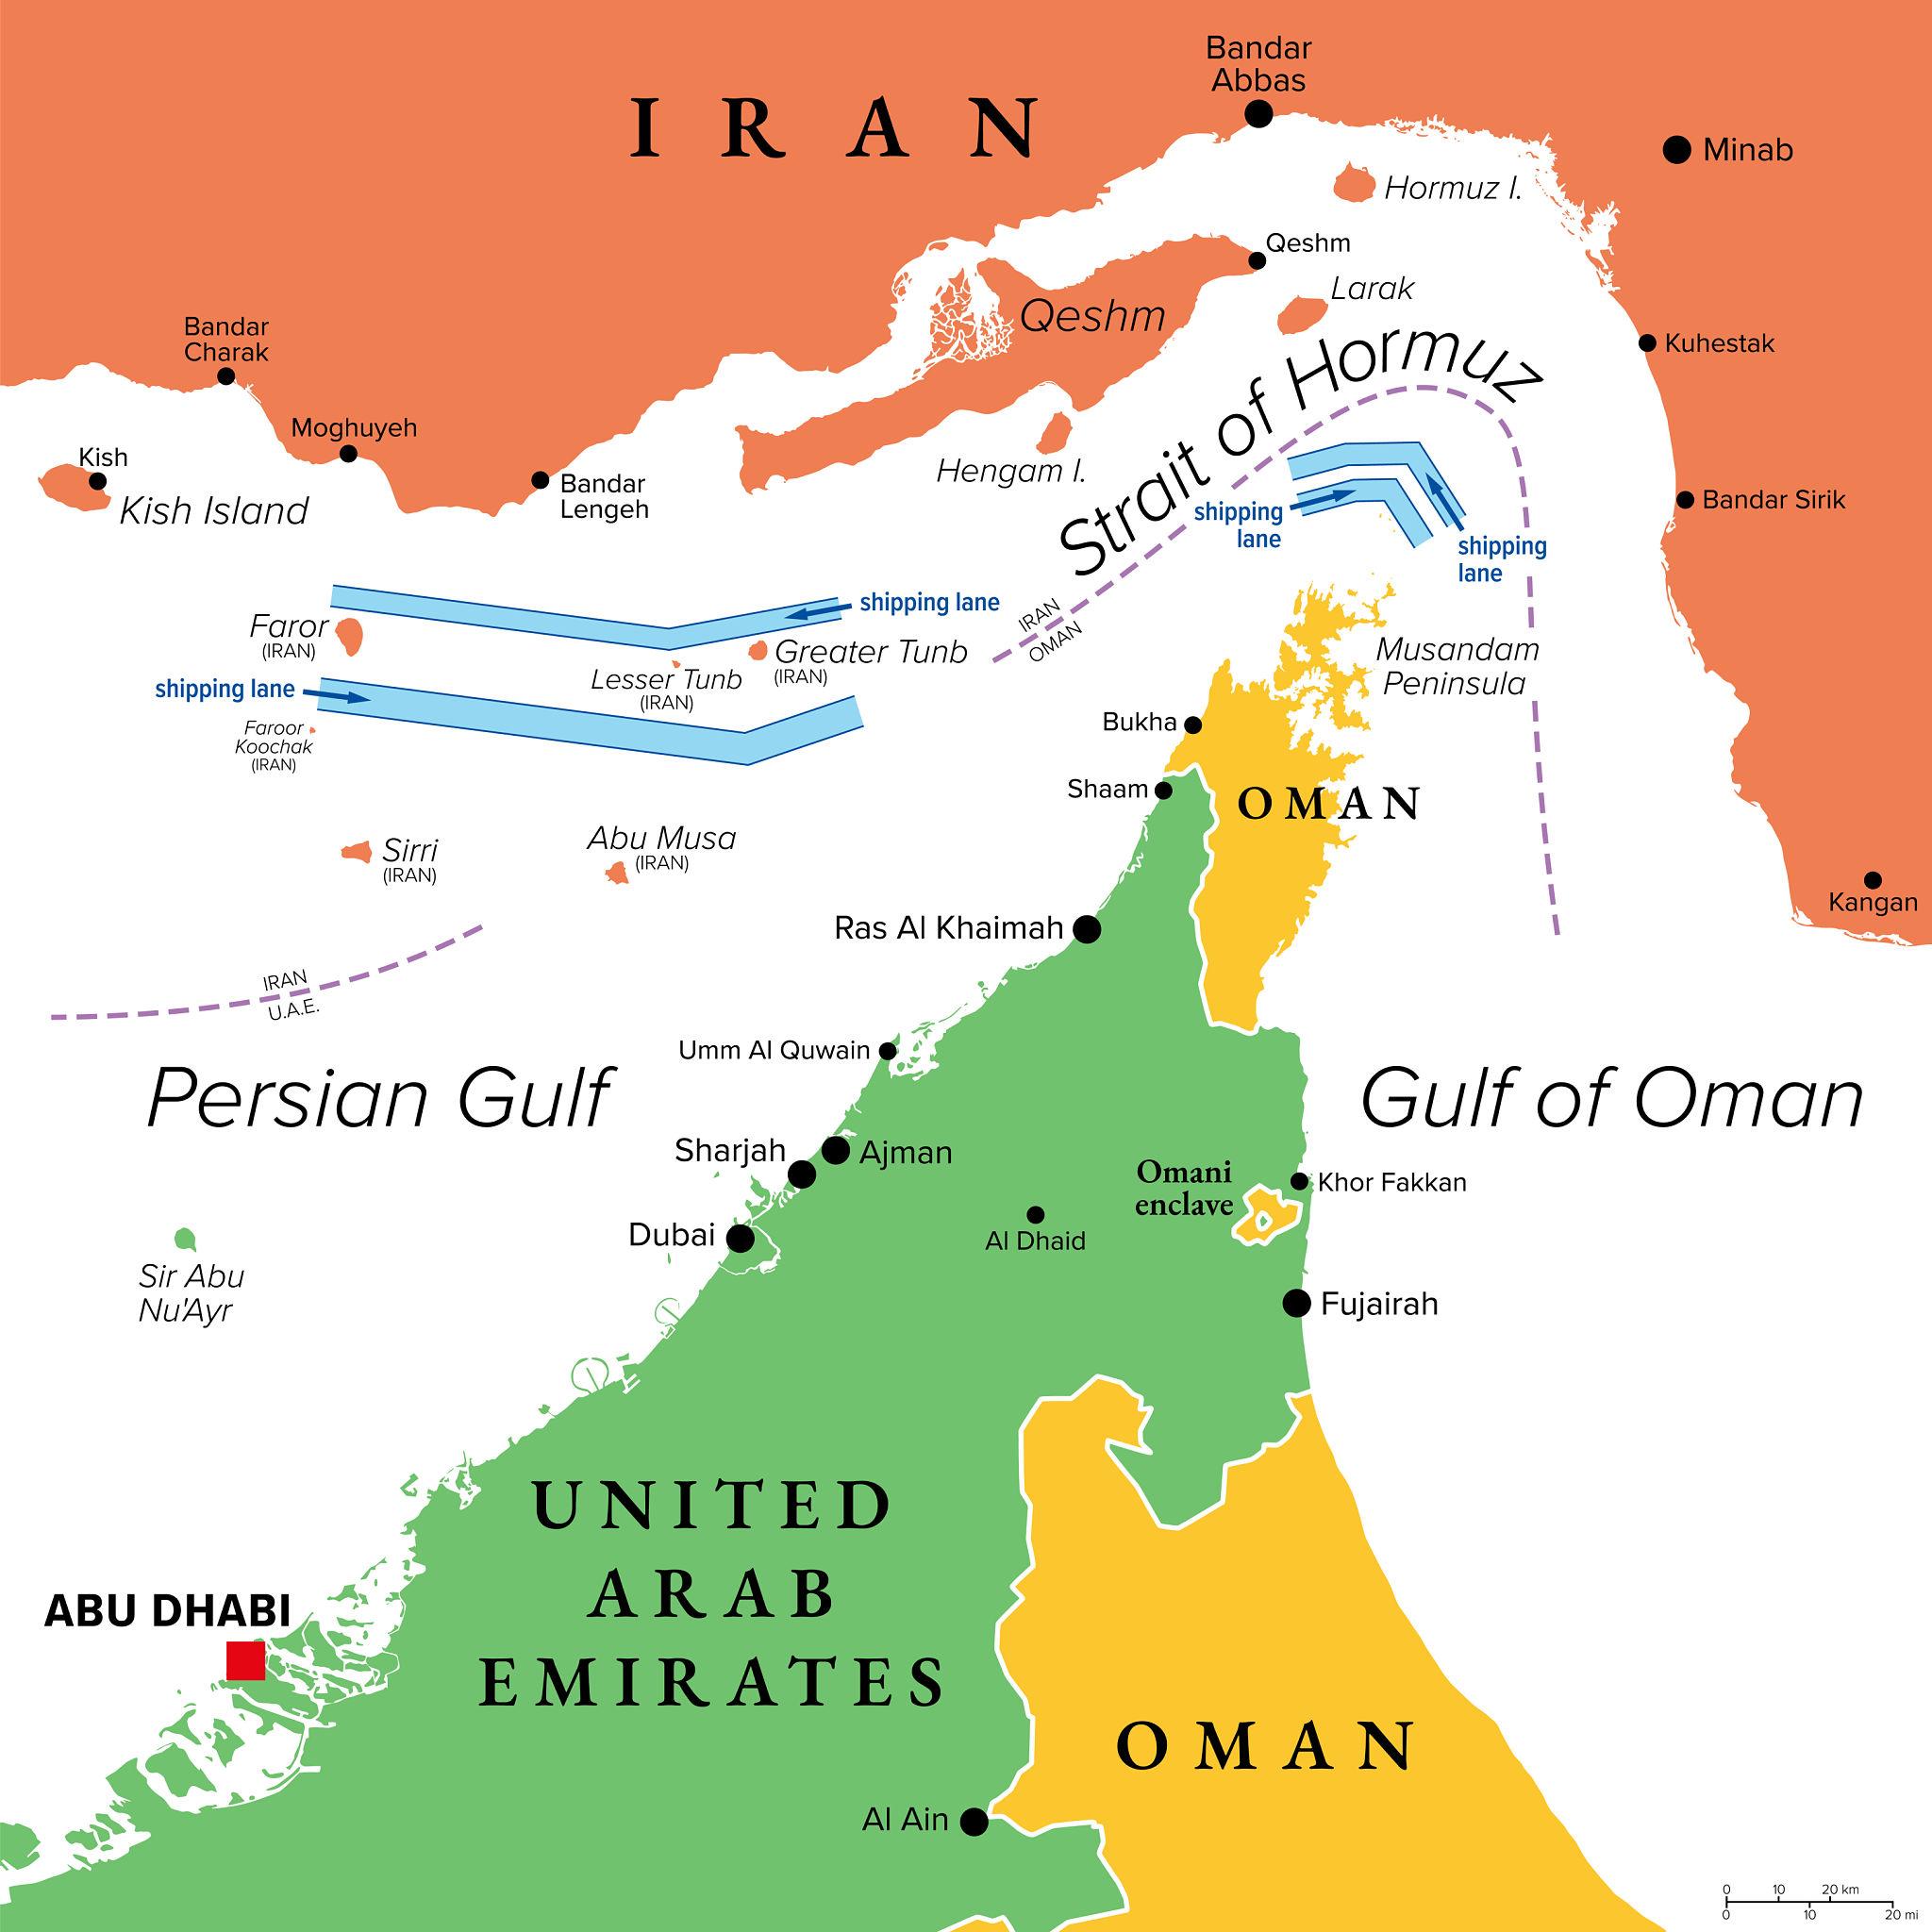
The strait sits at coordinates approximately 26.5°N, 56.5°E and forms the only maritime outlet from the oil-rich Persian Gulf to the open ocean. At its narrowest point, it is just 33–34 kilometres (21 miles) wide — a geographical bottleneck that concentrates an extraordinary share of global energy trade through a single, confined passage.
| Geographic Feature | Measurement |
|---|---|
| Length of strait | ~167 km (104 miles) |
| Narrowest width | ~33 km (21 miles) |
| Maximum width | ~97 km (60 miles) |
| Each shipping lane width | ~3.2 km (2 miles) |
| Typical tanker depth required | 20–25 metres |
| North coast | Iran |
| South coast | Oman (Musandam Peninsula) & UAE |
For a detailed interactive map with port locations, island positions, and shipping lane overlays, visit our dedicated Strait of Hormuz Map page.
Strait of Hormuz Map — Middle East
On a Middle East map, the Strait of Hormuz appears as a narrow gap at the base of the Persian Gulf, separating the Arabian Peninsula from the Iranian plateau. The surrounding region includes some of the world’s highest concentrations of proven oil reserves — Saudi Arabia, Iraq, Kuwait, UAE, Qatar, and Iran all rely on the strait for the majority of their export revenues.
Key regional landmarks relative to the strait:
| Location | Country | Relation to Strait |
|---|---|---|
| Bandar Abbas | Iran | Major Iranian port, northern shore |
| Musandam Peninsula | Oman | Southern jaw of the strait |
| Fujairah | UAE | Gulf of Oman port, bypasses the strait |
| Abu Musa Island | Iran (disputed) | Inside the shipping lanes |
| Ras al-Khaimah | UAE | Southwest of the strait entrance |
| Khasab | Oman (Musandam) | Key Omani port on southern shore |
Iran’s control of the northern coastline and its occupation of disputed islands (Abu Musa, Greater and Lesser Tunb) gives it unparalleled military leverage over the passage. See our full Iran & the Strait of Hormuz analysis for more detail.
Strait of Hormuz — World Map Position
Globally, the Strait of Hormuz occupies one of the most strategically sensitive positions on earth. It lies at the intersection of three major water bodies — the Persian Gulf, Gulf of Oman, and Arabian Sea — which themselves connect to the Indian Ocean. This positions it as the gateway through which Middle Eastern oil reaches its primary consumers in Asia and Europe.
No other single maritime chokepoint concentrates this volume of global energy trade. The Suez Canal, Bab-el-Mandeb, and Malacca Strait are all important — but none handles as large a share of irreplaceable energy flows as Hormuz, because unlike those straits, most Persian Gulf oil and all Qatari LNG have no viable alternative export route.
Strait of Hormuz on a Map — What to Look For
When locating the Strait of Hormuz on any map, look for the narrow bottleneck at the southeastern corner of the Persian Gulf. The shape is distinctive: the Gulf narrows sharply from a wide body of water to a thin passage approximately 33 km across before opening into the Gulf of Oman.
Key features to identify on a map:
- Iranian coastline — the long northern shore, including Bandar Abbas (Iran’s main naval base)
- Musandam Peninsula — the dramatic mountainous Omani exclave jutting northward from the Arabian Peninsula
- Traffic Separation Scheme (TSS) — two 3.2 km-wide lanes, inbound and outbound, running through Omani territorial waters
- Disputed islands — Abu Musa, Greater Tunb, Lesser Tunb, positioned directly in the shipping lanes
- Larak Island — used by Iran in 2026 as a control point for permitted transit
Explore an annotated interactive version on our dedicated map page.
What Percent of the World’s Oil Passes Through the Strait of Hormuz?
The U.S. Energy Information Administration (EIA) ranks the Strait of Hormuz as the world’s most important oil transit chokepoint by volume. The top exporters by volume through the strait in 2024 were:
| Country | Share of Hormuz crude flows | Volume (approx.) |
|---|---|---|
| Saudi Arabia | 38% | ~5.5 million b/d |
| Iraq | ~17% | ~3.4 million b/d |
| UAE | ~15% | ~3.0 million b/d |
| Kuwait | ~9% | ~1.8 million b/d |
| Iran | ~8% | ~1.5 million b/d |
| Qatar (LNG) | ~100% of LNG exports | ~112 bcm/year |
Of the crude oil and condensate flowing through the strait, 84% was destined for Asian markets, with China, India, Japan, and South Korea being the top four destinations. The 2026 crisis has severely disrupted these flows — follow live updates at our Risk Monitor.
Strait of Hormuz Map — Live Ship Tracker
During the 2026 crisis, the live map has become an essential resource for tracking which vessels are transiting, which are turning back, and where the IRGC is enforcing restrictions. Under normal conditions, the tracker shows 100+ vessels in transit at any given time. During the current blockade period, that number has fallen to single digits on many days.
The live tracker aggregates data from both terrestrial and satellite AIS (Automatic Identification System) receivers — the mandatory transponder system on commercial vessels over 300 gross tonnes. During the crisis, a significant number of vessels have disabled their transponders (“going dark”), so live counts represent a confirmed floor, not the ceiling.
🛰 Track Ships in Real Time
View live vessel positions, AIS data, vessel types, speeds, and transit counts — updated every 60 seconds for the Strait of Hormuz passage zone.
Open Live Ship Tracker →Strait of Hormuz — Pronunciation
The name “Hormuz” derives from the Middle Persian pronunciation of the Zoroastrian deity Hormoz (Ahura Mazda). An alternative etymology suggests it comes from the local Persian word Hur-Mogh (هورمغ), meaning “Place of Dates.” A third theory links it to the Greek word ὅρμος (hormos), meaning “bay” or “cove.”
Common mispronunciations include “HOR-muhz,” “hor-MYOOZ,” and “HOR-muz.” The correct form, as used by Persian speakers and international news broadcasters, is consistently hor-MOOZ.
Strait of Hormuz Importance — Why It Matters
The EIA, IEA, and every major energy security institution rank Hormuz above all other maritime chokepoints in strategic importance. Here is why:
| Factor | Why It Matters |
|---|---|
| No alternative route | Pipeline bypass capacity covers only ~3.5–5.5 million b/d vs 20 million b/d normal flow. All Qatari LNG has zero bypass option. |
| Volume concentration | 20% of global oil consumption through a 33 km gap — the highest concentration of any chokepoint |
| Asian dependency | China, India, Japan, South Korea receive 70%+ of their Gulf oil via Hormuz |
| LNG monopoly | Qatar — the world’s 2nd largest LNG exporter — has no alternative export route |
| Fertilizer flows | 30–35% of global urea exports (critical for food production) transit the strait |
| Iran’s leverage | Controlling the northern shore gives Iran an asymmetric deterrent that no sanctions can neutralise |
When the strait is disrupted, the effects cascade rapidly: oil prices spike within hours, LNG markets tighten within days, and inflation follows within weeks. The 2026 crisis has demonstrated this chain in real time — Brent crude reached $126/barrel at peak.
Strait of Hormuz News — Latest Developments
The Strait of Hormuz has been at the centre of the world’s most significant energy crisis since the 1970s, following U.S. and Israeli strikes on Iran on February 28, 2026, which triggered Iran’s closure of the waterway to most commercial shipping.
Key recent developments (reverse chronological):
| Date | Development |
|---|---|
| Apr 22, 2026 | IRGC seizes MSC Francesca and Epaminondas; third vessel fired upon |
| Apr 18, 2026 | Iran re-closes strait after US refuses to lift naval blockade of Iranian ports |
| Apr 17, 2026 | Iran briefly declares strait open; oil prices fall 10%; Wall Street rallies |
| Apr 13, 2026 | US Navy blockade of Iranian ports begins — “Operation Sentinel Shield” |
| Apr 8, 2026 | Two-week US-Iran ceasefire framework announced; limited transit resumes |
| Apr 7, 2026 | Iran proposes transit fee system ($1M+ per ship) |
| Mar 19, 2026 | US military campaign begins to reopen strait; mine-clearing operations start |
| Mar 2, 2026 | IRGC officially confirms strait closed; threatens to fire on any vessel |
| Feb 28, 2026 | IRGC issues radio warnings: “no ship is allowed to pass the Strait of Hormuz” |
📰 Full News Feed
Our Latest page tracks all breaking developments on the strait — updated multiple times daily as the situation evolves.
Read All Latest News →Strait of Hormuz Status — Is It Open or Closed?
| Factor | Current Status (April 22, 2026) |
|---|---|
| Passage type | Permission-based / Selective IRGC control |
| Daily transits | <10 vessels (vs 130+ pre-crisis) |
| Electronic warfare | Widespread GPS spoofing and radar jamming |
| War risk insurance | Record-high premiums; many policies voided |
| US blockade | Active — all Iranian port traffic interdicted |
| Mine threat | Confirmed; mine-clearing operations ongoing |
| Ships stranded | ~2,000 vessels in Gulf or Gulf of Oman |
For a live composite closure risk score based on six weighted indicators, see our Hormuz Risk Monitor.
Strait of Hormuz Google Map
Google Maps labels the strait and shows the surrounding bodies of water — Persian Gulf to the west and Gulf of Oman to the east. In satellite view, you can see the narrow passage between the Iranian and Omani coastlines, though the specific shipping lane markings are more clearly shown on maritime navigation charts.
For a purpose-built Hormuz map with annotated ports, islands, shipping routes, pipeline bypass routes, and 2026 crisis overlays — more useful than Google Maps for strategic analysis — visit our dedicated interactive map.
Is the Strait of Hormuz Closed or Open?
The history of this closure phase:
- Feb 28, 2026: IRGC issues first “no passage” radio warnings
- Mar 2, 2026: Full closure declared; attacks on vessels begin
- Mar–Apr 2026: Selective passage for neutral nations only
- Apr 8, 2026: Ceasefire framework; limited transit briefly resumes
- Apr 17, 2026: Iran declares full opening — lasts ~24 hours
- Apr 18, 2026: Re-closure after US refuses to lift port blockade
- Apr 22, 2026: Active IRGC enforcement; seizures of vessels
The strait has never before been successfully closed for more than brief periods. The current closure — now in its eighth week — is the longest sustained disruption in history. Check our Risk Monitor for the current composite risk score.
Strait of Hormuz Today — April 22, 2026
Energy: Brent crude trading near $100/barrel. ~1 billion barrels of production at risk if blockade persists through Q2.
Diplomatic: Talks continuing in Islamabad; ceasefire framework technically active but conditions deteriorating. US naval blockade of Iranian ports remains enforced.
| Indicator | Today’s Reading |
|---|---|
| Daily vessel transits | <10 (pre-crisis avg: 130+) |
| Brent crude oil price | ~$100/barrel |
| Vessels stranded in Gulf | ~2,000 |
| US Navy blockade status | Active — Iranian ports interdicted |
| War risk insurance | Record premiums / many policies voided |
| IRGC threat level | Critical — “shoot on sight” for unauthorized vessels |
For real-time updates throughout the day, our Latest News page is updated multiple times daily. Our live ship tracker shows vessel movements as they happen.
Strait of Hormuz Blockade News
The 2026 Hormuz blockade is the most severe maritime crisis since World War II. Below is a structured overview of the blockade’s key phases:
| Phase | Period | Key Events |
|---|---|---|
| Initial Closure | Feb 28 – Mar 4 | IRGC warnings; oil majors suspend transit; insurance withdrawn |
| Selective Blockade | Mar 4 – Apr 7 | Neutral nations permitted case-by-case; 21+ vessel attacks |
| Ceasefire & Partial Opening | Apr 8–17 | Two-week ceasefire; limited transit briefly resumes |
| Dual Blockade | Apr 13–present | US naval blockade of Iranian ports begins; Iran re-closes strait |
The blockade has been described by the IEA as “the largest disruption to global energy supply since the 1970s oil crisis.” For the complete event-by-event account, visit our Crisis Timeline (1973–2026).
Straits of Hormuz News — What the World Is Reporting
The “Straits of Hormuz” (the plural form is also widely used) is the most-covered geopolitical story of 2026. Global media coverage has focused on several interconnected threads:
| Topic | Key Angles Being Covered |
|---|---|
| Energy markets | Oil price movements, strategic reserve releases, LNG spot price surge |
| Shipping | Maersk, MSC, Hapag-Lloyd transit suspensions; Cape of Good Hope rerouting |
| Diplomacy | Pakistan/Oman mediation; Islamabad talks; ceasefire terms |
| Military | US Fifth Fleet operations; IRGC mine deployment; drone attacks |
| Economic impact | IMF growth forecast cuts; fertilizer supply crisis; food price inflation |
| Geopolitics | China’s role; NATO fractures; Gulf state responses |
For curated, real-time coverage across all of these threads in one place, our Latest News page aggregates and contextualises global reporting on the strait.
Iran Strait of Hormuz Closure — Why and How
Iran’s ability to close or restrict the strait is the product of decades of deliberate military investment. Its key capabilities include:
- Sea mines: Estimated 5,000+ mines deployable via high-speed boats; several confirmed in shipping lanes since March 2026
- Fast attack craft (FAC): IRGC operates hundreds of small, fast boats capable of swarming larger vessels
- Anti-ship missiles: Shore-based launchers throughout the strait on mobile platforms
- Submarine threat: Iran operates a fleet of midget and conventional submarines
- Island control: Abu Musa, Greater and Lesser Tunb sit directly in the shipping lanes
- Electronic warfare: GPS spoofing and radar jamming reported throughout the crisis
Iran’s strategic calculation is that closure — or the threat of closure — gives it leverage that no financial pressure can match. As long as 20% of world oil depends on the strait, Iran holds a card that forces global powers to negotiate. Read our full analysis at Iran & the Strait of Hormuz.
Iran Closed the Strait of Hormuz — What Happened
The sequence of events that triggered the closure:
- Failed Geneva talks (late 2025) — Nuclear negotiations between Iran and the US collapsed
- 12-day air conflict (2025) — A prior limited engagement between Israel and Iran escalated tensions
- US-Israeli strikes (Feb 28, 2026) — Airstrikes on Iranian nuclear and military facilities; Khamenei assassinated
- IRGC radio warnings (Feb 28) — Strait declared closed to all foreign shipping
- Oil majors suspend transit (Feb 28–Mar 1) — Maersk, MSC, Hapag-Lloyd, CMA CGM all halt Hormuz operations
- Insurance withdrawn (Mar 5) — War risk coverage pulled; transit commercially unviable
- Vessel attacks begin — 21+ confirmed attacks on merchant ships as of April 2026
See the complete event-by-event record at our Crisis Timeline.
Strait of Hormuz Oil Impact — Global Economic Consequences
The impacts extend far beyond the energy sector:
| Sector | Impact |
|---|---|
| Oil markets | Brent crude surged 94% from pre-war levels at peak ($65 → $126/barrel) |
| LNG / gas | Qatar declared force majeure; European and Asian gas prices spiked dramatically |
| Shipping costs | Container rates surged 60%+; Cape of Good Hope rerouting adds weeks to transit times |
| Insurance | War risk premiums up 1,000%+ for Gulf shipping; many policies voided entirely |
| Fertilizers | 30–35% of global urea exports blocked; food price inflation accelerating |
| Global GDP | IMF cut 2026 global growth forecast; MENA region slashed from 3.9% to 1.1% |
| Asian economies | Japan, South Korea, India face physical supply constraints, not just price exposure |
Hormuz Strait Blockade — The Military Standoff
| Force | Operation | Scope |
|---|---|---|
| Iran IRGC | Selective closure enforcement | Controls northern shore; mines in lanes; attacks on vessels |
| US Fifth Fleet | Operation Sentinel Shield | 12 warships, 10,000+ personnel; Iranian port traffic interdicted |
| US military | Mine-clearing operations | Begun April 11, 2026; GBU-72 strikes on Iranian naval silos |
| Multinational coalition | Forming (22 countries signed statement) | Planning phase; no vessels yet deployed to strait |
The blockade has created economic pressure on both sides. Iran loses an estimated $435 million per day in trade revenues. The global economy loses access to 20 million barrels of daily oil supply. For the US, controlling the strait means controlling the petrodollar system underpinning American economic dominance.
📊 Live Risk Gauge
Track the Hormuz closure probability in real time — a composite index updated daily based on six weighted indicators including IRGC threat level, insurance conditions, and naval presence.
View Risk Monitor →Strait of Hormuz Tensions — A History
The 2026 crisis did not emerge in a vacuum. Tensions over the Strait of Hormuz have recurred throughout the modern era, always tied to the broader US-Iran confrontation and to the global economy’s dependence on Persian Gulf oil.
| Year | Event |
|---|---|
| 1973 | Arab Oil Embargo — first demonstration of Persian Gulf oil as geopolitical weapon |
| 1984–88 | Tanker War (Iran-Iraq War) — both sides attack shipping; US Navy escorts introduced |
| 1988 | Operation Praying Mantis — largest US naval surface battle since WWII |
| 2011–12 | Iran threatens closure in response to US/EU sanctions escalation |
| 2019 | Series of tanker attacks; drone shootdowns; US-Iran tensions peak |
| 2024 | MSC Aries seized by Iranian Navy in the Gulf of Oman |
| 2025 | 12-day US-Israel-Iran air conflict; nuclear talks collapse in Geneva |
| Feb–Apr 2026 | Current crisis — longest sustained closure in history |
For the full annotated timeline from 1973 to the present, visit our Strait of Hormuz Crisis Timeline.
Strait of Hormuz Traffic — Ships, Tankers & Transit Data
| Metric | Normal (Pre-2026) | Crisis (April 2026) |
|---|---|---|
| Daily vessel transits | 130–160 | <10 |
| Oil flow (crude + products) | ~20 million b/d | <2 million b/d (est.) |
| LNG transit | ~112 bcm/year | Near zero |
| Container ships | 12–15 per day | 0–1 per day |
| War risk insurance | 0.125% of vessel value/transit | 0.5–1.25% / many policies voided |
| Vessel type breakdown | 47% tankers, 18% bulk, 12% container | Mostly IRGC patrol and select neutral tankers |
The Traffic Separation Scheme (TSS) — two opposing 3.2 km-wide lanes operating under Omani territorial waters — which normally governs all commercial transit, has been effectively suspended. Iranian forces control which vessels may use the waterway and on what terms.
🚢 Track Live Traffic
Our live ship tracker shows real-time AIS vessel data updated every 60 seconds — see exactly how many ships are transiting the strait right now.
Open Live Ship Tracker →