
Simple Map
A clean English-labeled map showing Iran, Oman, the Persian Gulf, the Strait of Hormuz, and tanker direction.

Oil Flow Infographic
A content-ready infographic showing major Gulf exporters, the Strait of Hormuz, and destination markets.

Country Exposure Chart
An exposure chart you can use to explain which economies may feel a Hormuz disruption most.

Alternative Pipeline Graphic
A visual of major pipeline routes that reduce reliance on the Strait of Hormuz.

What Happens If Closed Flowchart
A clear impact chain from shipping disruption to prices, inflation, markets, and consumers.

Timeline Graphic
A timeline-style graphic for evergreen updates around Strait of Hormuz tensions and market impacts.

Vital Global Chokepoint
Location map showing the Strait of Hormuz, nearby waters, and quick facts including length, narrowest width, daily oil flow, and share of global maritime oil trade.
Download Visual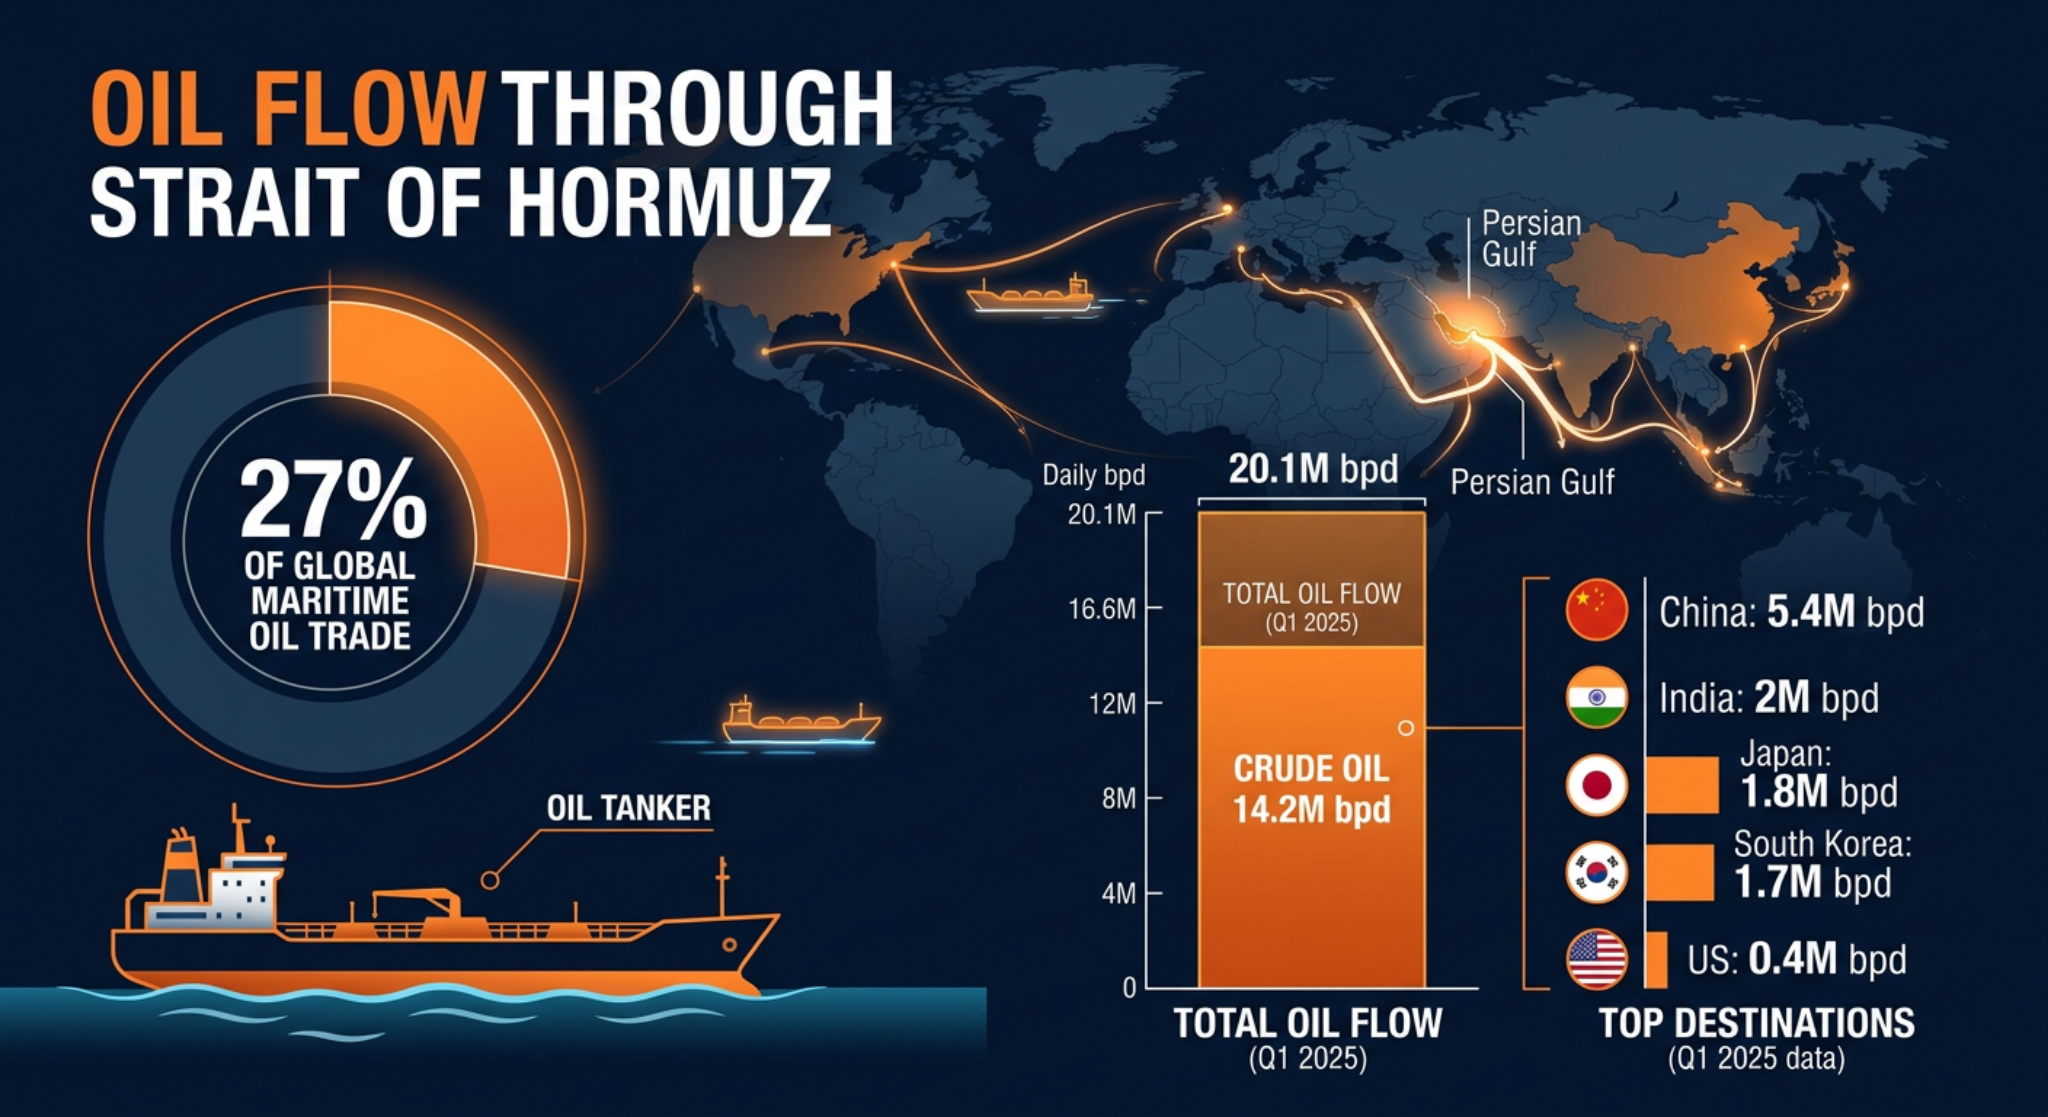
Oil Flow Through the Strait of Hormuz
Oil flow infographic showing the share of global maritime oil trade, estimated Q1 2025 volumes, and top destination markets.
Download Visual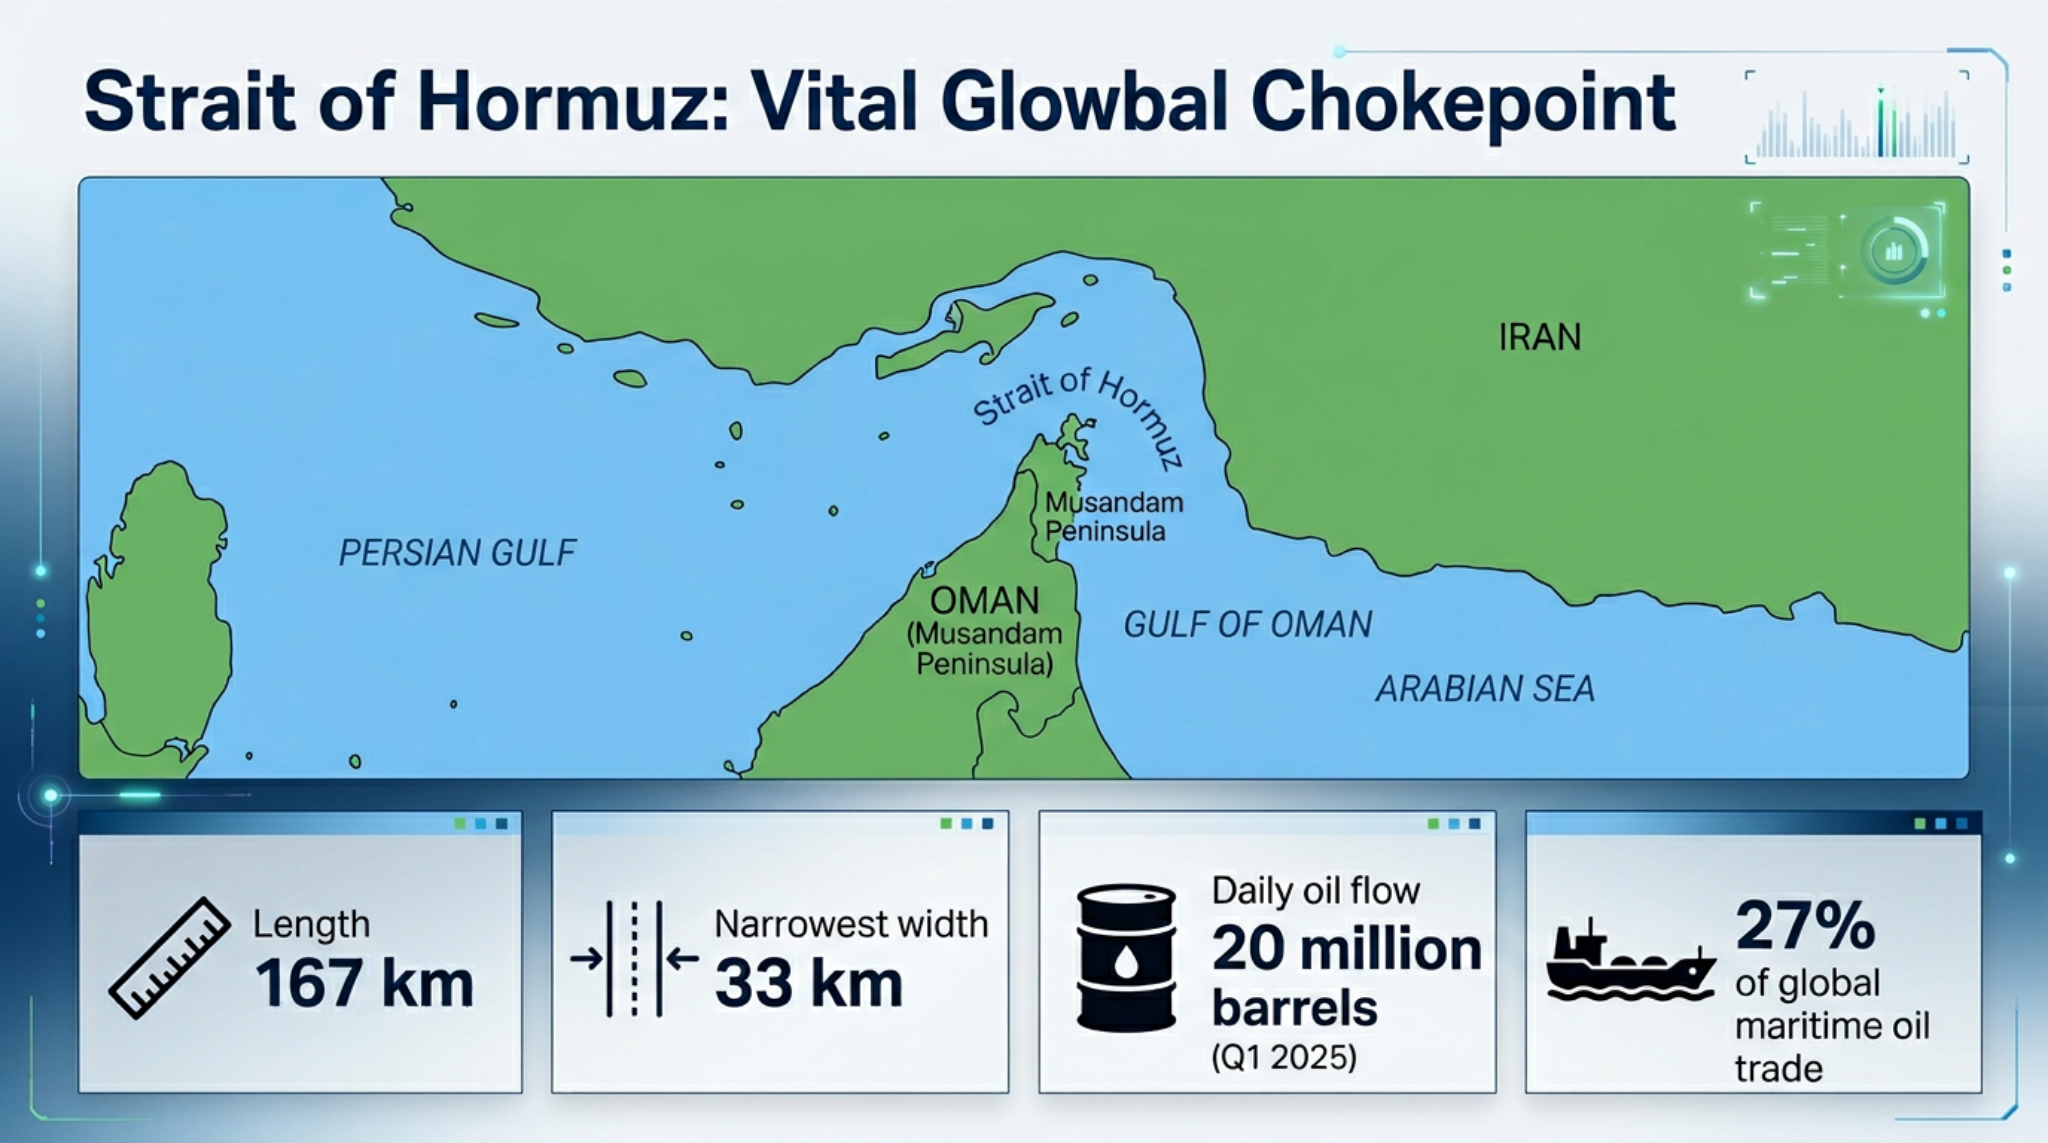
Location Map and Key Dimensions
Reference map focused on the Strait of Hormuz and surrounding geography, useful as a general explainer visual.
Download Visual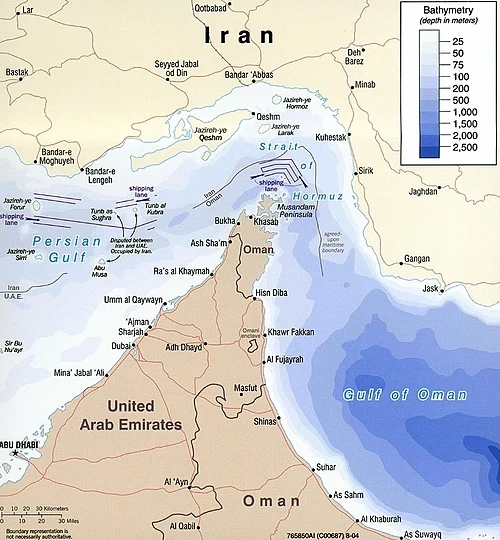
Geopolitical Borders
Map of Iran, Oman, Musandam, and nearby islands showing disputed territory and border context.
Download Visual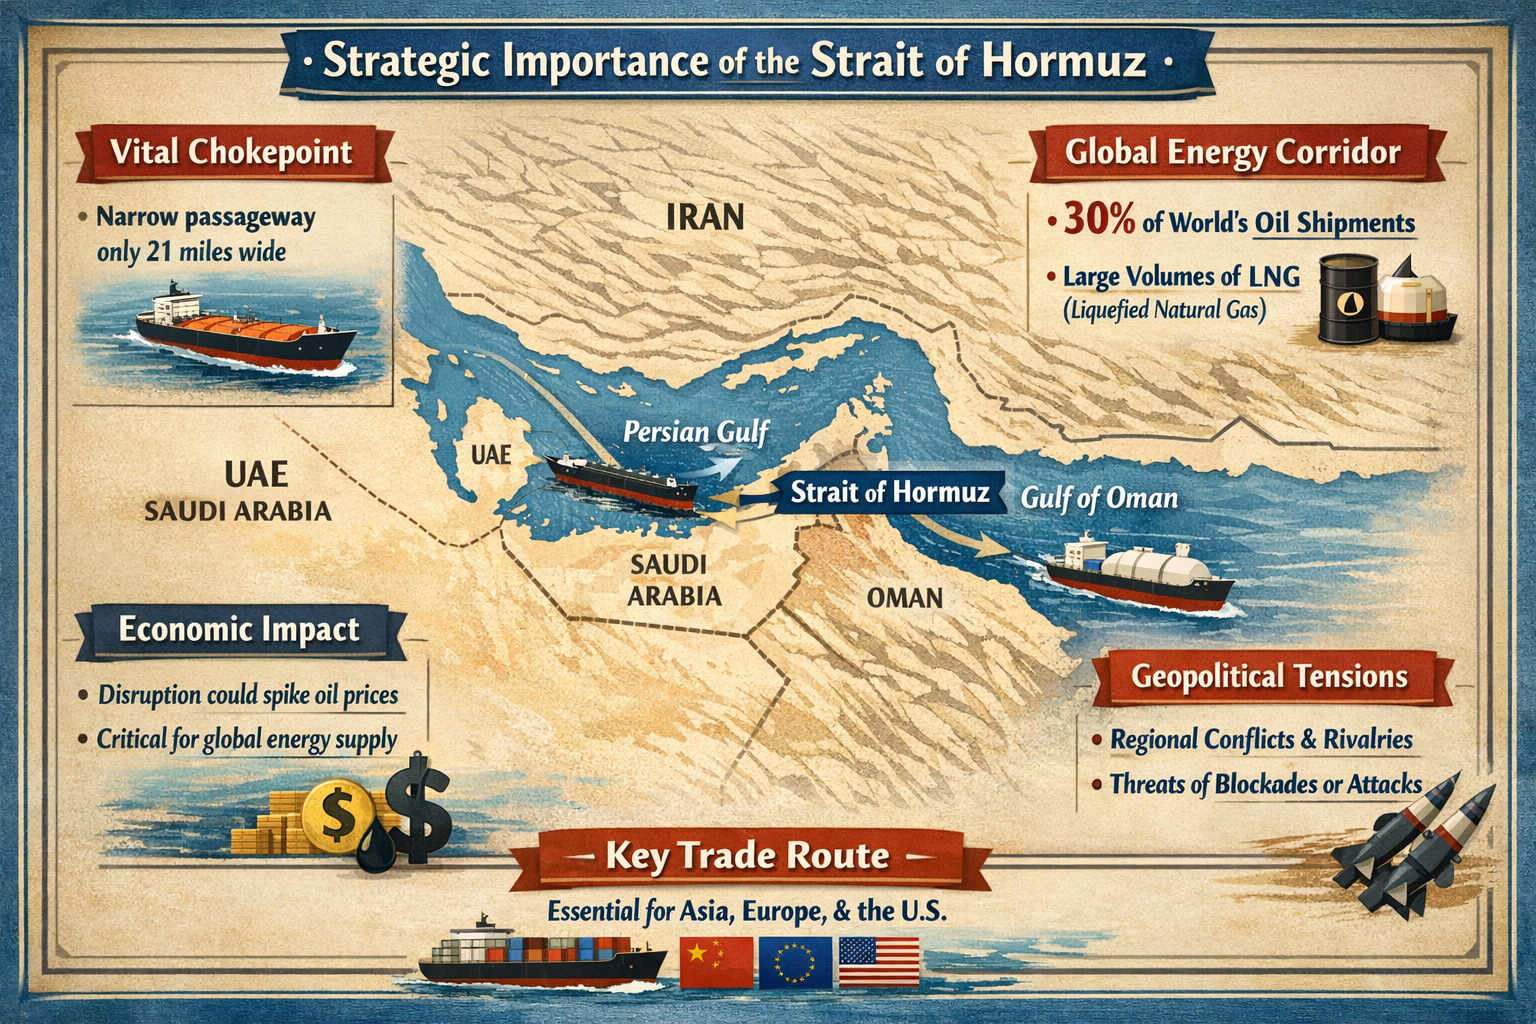
Strategic Importance Summary
Summary infographic on why Hormuz remains one of the world’s most important energy chokepoints.
Download Visual1. Disruption at the Strait of Hormuz
- Oil and LNG shipments are delayed, reduced, or rerouted
- Shipping insurance costs jump sharply
- Freight rates rise as risk increases
2. Global Supply Shock
- Less crude reaches international markets
- Importing nations begin stockpiling
- Strategic reserves may be released for temporary support
3. Refinery Pressure
- Refineries face shortages of preferred crude grades
- Input costs rise across the refining sector
- Fuel output may tighten, especially petrol, diesel, and jet fuel
4. Oil and Energy Price Surge
- Crude prices rise on global exchanges
- Retail fuel prices increase
- Airlines, logistics firms, and manufacturers face higher operating costs
5. Trade and Supply Chain Disruption
- Shipping becomes more expensive worldwide
- Delivery times lengthen for goods and raw materials
- Import and export costs increase across sectors
6. Inflationary Pressure
- Transport costs feed into food and consumer prices
- Energy-intensive industries pass costs to buyers
- Households lose purchasing power as essentials become more expensive
7. GDP and Growth Impact
- Economic growth slows in import-dependent countries
- Trade deficits may widen
- Currency volatility and investor uncertainty increase
8. Longer-Term Strategic Effects
- Governments invest in alternative routes and energy security
- Businesses diversify supply chains and sourcing strategies
- Interest in pipelines, reserves, and renewables increases
Disruption → Supply Shock → Refinery Strain → Price Spike → Trade Disruption → Inflation → GDP Slowdown